A Case For A Bull Market In 2020
Published Friday, December 20, 2019 at: 7:00 AM EST
What if the glass is half full? What if the optimists are right?
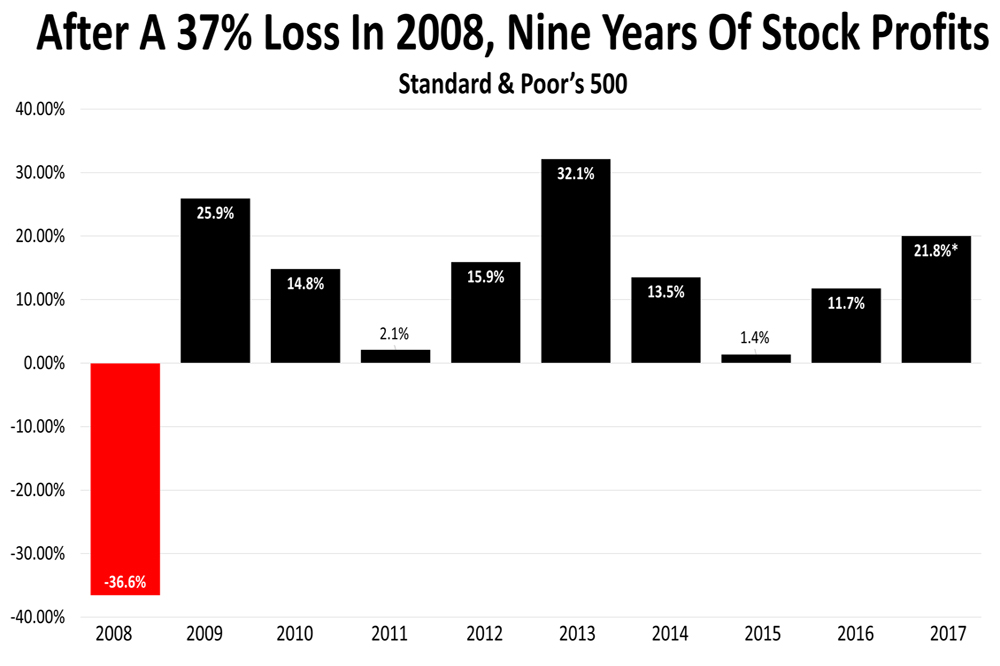
Although no one can predict the next big move in stocks, and you don't want to bet your retirement portfolio on it, it's not hard to see the case for a bull market in 2020 — even after a spectacular year for stocks in 2019. (Stock prices are up more than 28% with six trading days left in the year.)
With interest rates and inflation lower than expected and no sign of change in these trends on the horizon, the stock market multiple is higher than normal and arguably could easily go higher.
The Standard & Poor's 500 index historically trades at a market multiple of 16 to 18 times its expected earnings. Put another way, the average share in the S&P 500 index historically has been priced at 16 to 18 times every dollar of profit that it's expected to earn in the next year.
Lately the price of the S&P 500 has been trading well above the normal valuation band, at about 19 times expected earnings. Normally that would be a bad sign of overvaluation.
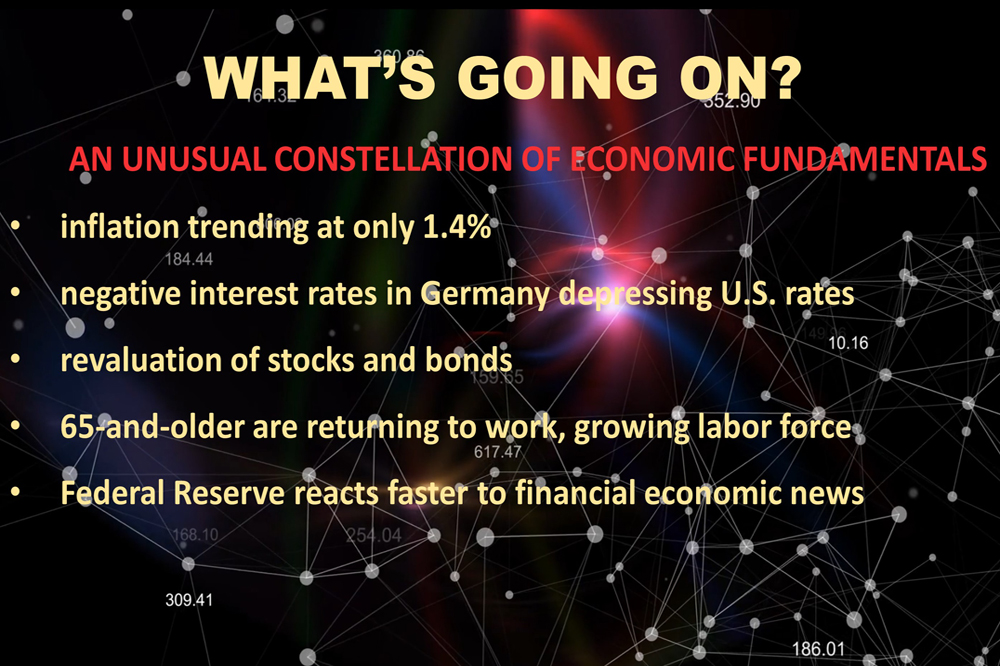
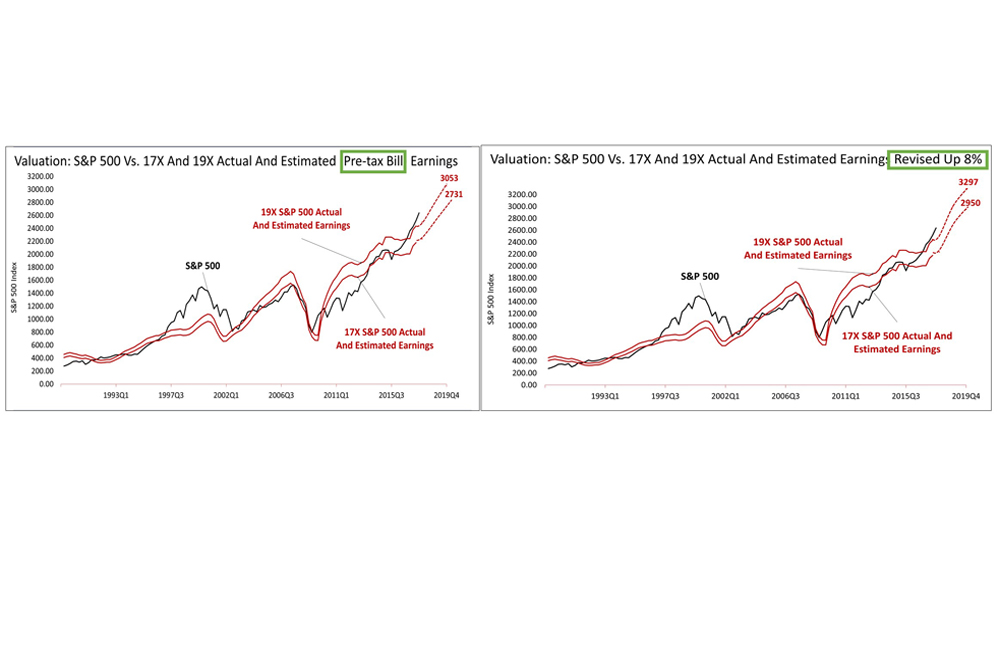
However, unprecedented fundamentals — negative interest rates in Europe and lower-than-expected inflation — are keeping yields on U.S. bonds low and driving investors into stocks. That's expanded the market multiple from 18 to 19. The chart shows what it would look like if the market multiple continues to stay at 19, above the historical norm.
The solid red lines represent the upper and lower valuation bands in the past, and the dotted red lines show the trajectory of the stock prices if stocks continue to trade at 19 times earnings. The black line in this chart shows the price of the S&P 500 through December 4th.
The red dotted lines are actual bottom-up S&P 500 operating earnings per share as of December 2nd, 2019; for 2018 of $161.93 and estimated 2019 earnings of $162.21, estimated 2020 earnings of $178.20 and estimated 2021 earnings of $197.64. The sources of the data are Yardeni Research, Inc. and Thomson Reuters I/B/E/S, for actual and estimated operating earnings from 2015; and Standard and Poor's for actual operating earnings data through 2014 and index stock price data through December 4th, 2019.
While you never make financial plans based on things going right, sometimes the glass is indeed half-full.
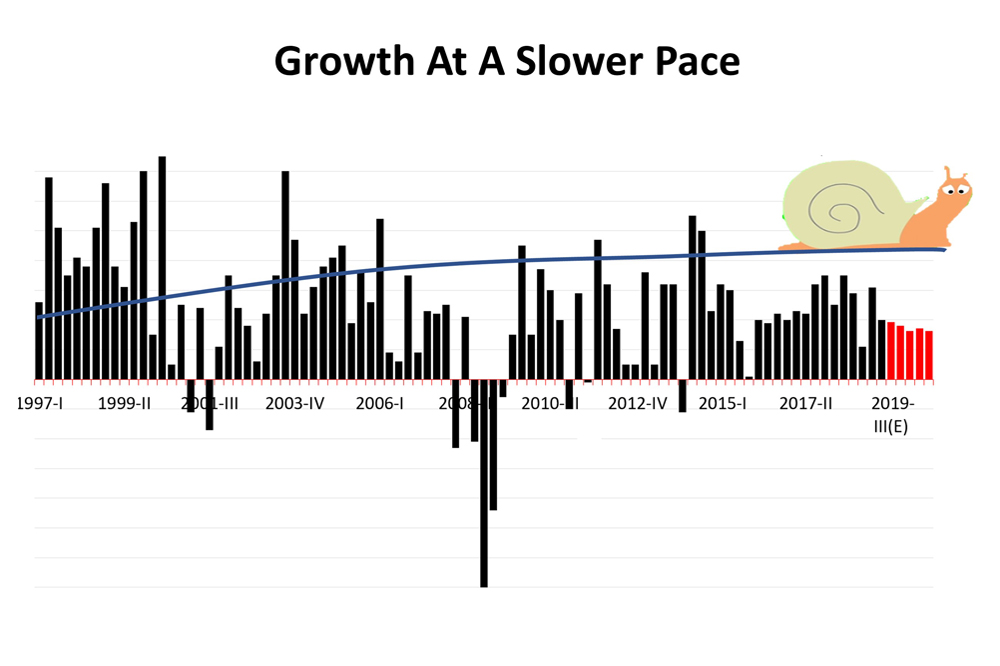
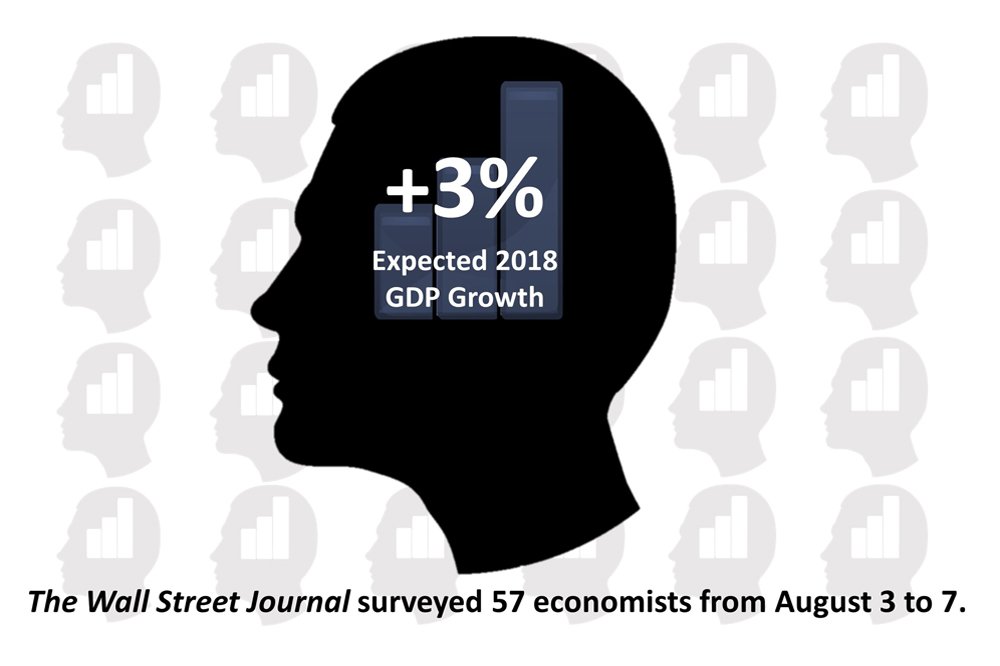
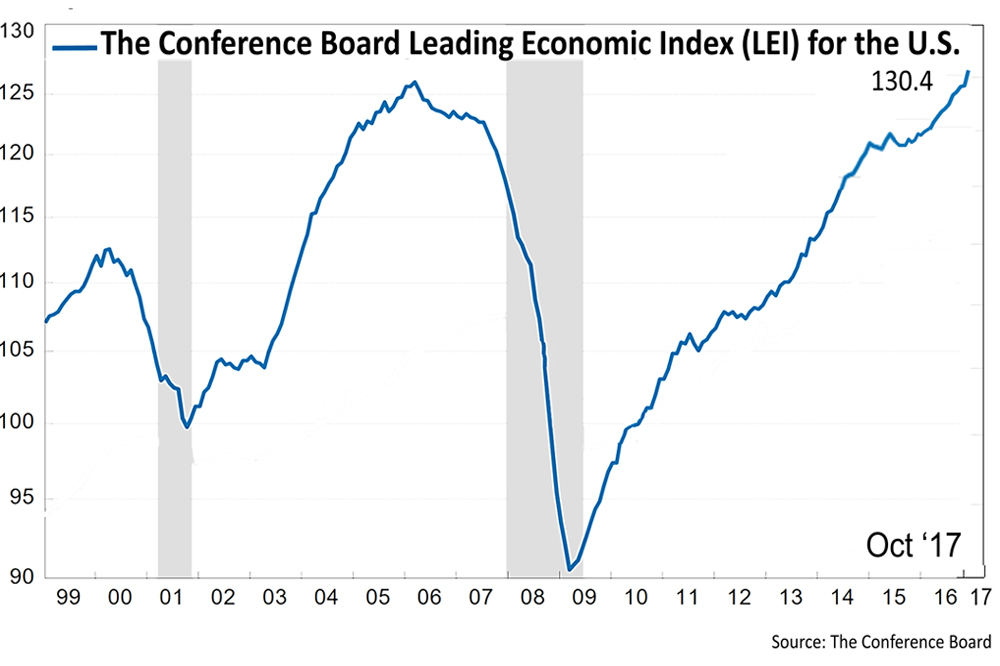
New economic data this week from The Conference Board on the leading economic indicators, the Census Bureau on housing starts, and the Bureau of Economic Analysis on real disposable income confirmed The Wall Street Journal's most recent consensus forecast of economists for an expected growth rate of just under 2% for the next five quarters.
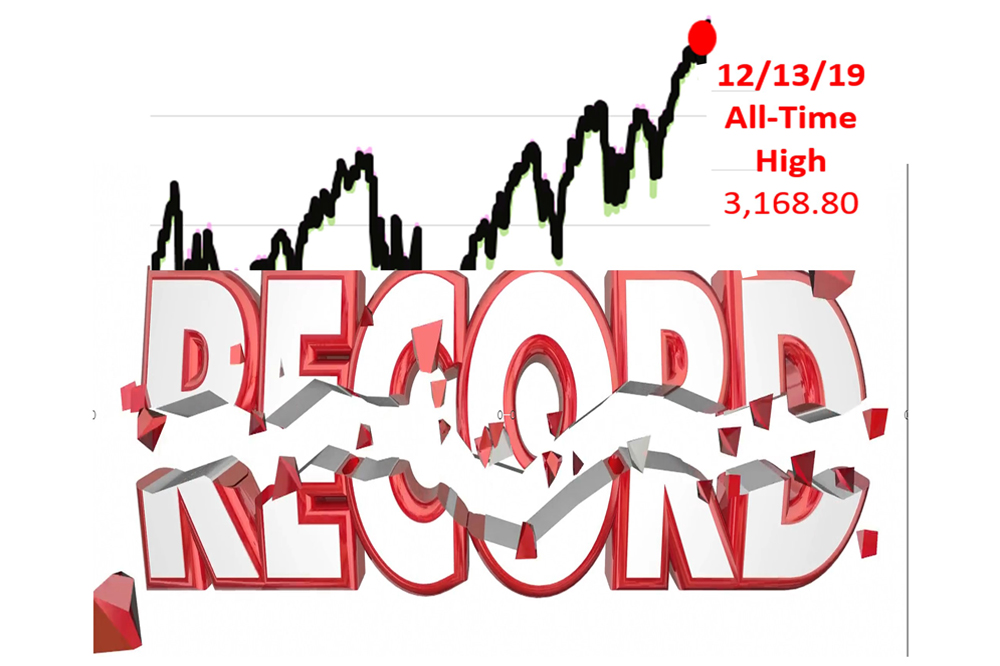
The Standard & Poor's 500 index broke records this past week, closing on Friday at a record-breaking 3,221.22.
This article was written by a veteran financial journalist based on data compiled and analyzed by independent economist, Fritz Meyer. While these are sources we believe to be reliable, the information is not intended to be used as financial or tax advice without consulting a professional about your personal situation. Tax laws are subject to change. Indices are unmanaged and not available for direct investment. Investments with higher return potential carry greater risk for loss. No one can predict the future of the stock market or any investment, and past performance is never a guarantee of your future results.
This article was written by a professional financial journalist for Advisor Products and is not intended as legal or investment advice.
2024
-
 Stocks Closed At A Record High
-
 Federal Reserve Projects Strong Growth
-
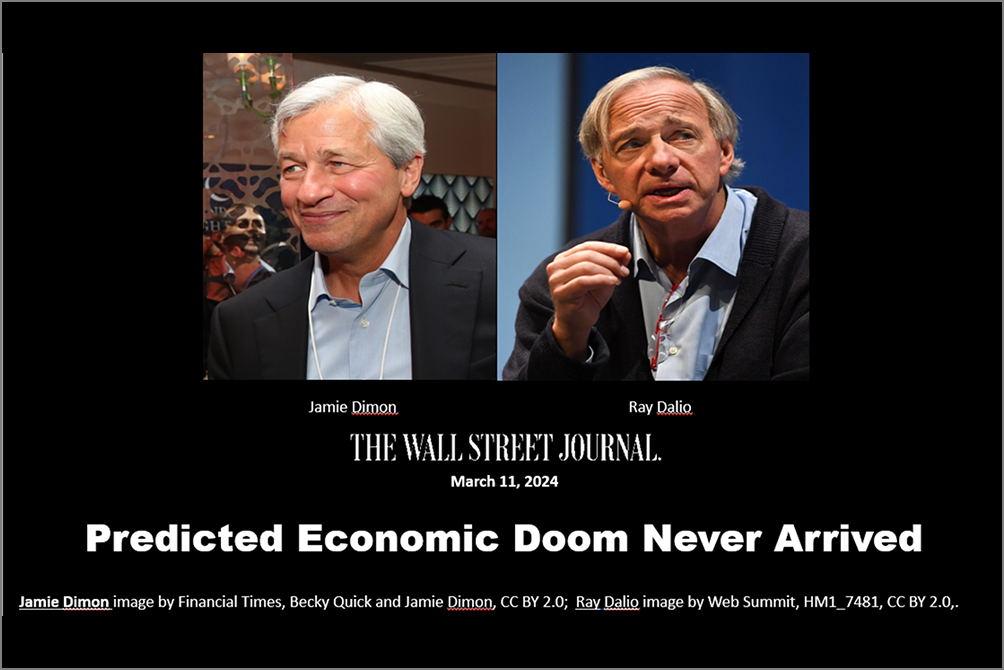 The Best People Were Wrong
-
 This Week’s Investment News In Six Charts
-
 U.S. Investor Picture Of The Week
-
 The Conference Board Backs Off Its Recession Forecast
-
 Softening Economic Data, Inflation Fears Dampen Stock Rally
-
 S&P 500 Closes Above 5000 For The First Time Ever
-
 Why America Is The World’s Economic Leader
-
 Investment News For The Week Ended Friday, January 26
-
 Why Stocks Broke The All-Time Record High
-
 A Strategic Update, With Stocks Near All-Time High And Crises Unfolding


