Are The Five Stocks Driving The Market's Great Returns Overvalued?
-

-

Published Friday, October 15, 2021 at: 4:46 PM EDT
Including dividends, the S&P 500 Total Return index, in the five years ended September 30, 2021, gained an astonishing +118%, an average annual growth rate of nearly 24%! That’s more than double the stock market’s long-term annual total return of approximately +10% going back 200 years, as described by Wharton Business School’s professor Jeremy Siegel in his seminal book, Stocks for the Long Run!
The amazing return came despite the COVID pandemic bear market plunge in February and March 2020, when stocks plunged by -33.9%, the S&P 500 total return more than doubled in this fraught-filled five-year period.
The performance of the five largest companies in the S&P 500 -- Apple, Microsoft, Amazon, Google and Facebook – has led the recovery in stocks. And, because the major stock indexes are weighted by market capitalization, these five stocks account for 25% of the performance of the S&P 500. To be sure, the super returns on these five stocks powered the amazing returns. Yet their valuations are not out of control, if you compare the P/E ratios on these companies to their estimated earnings growth.
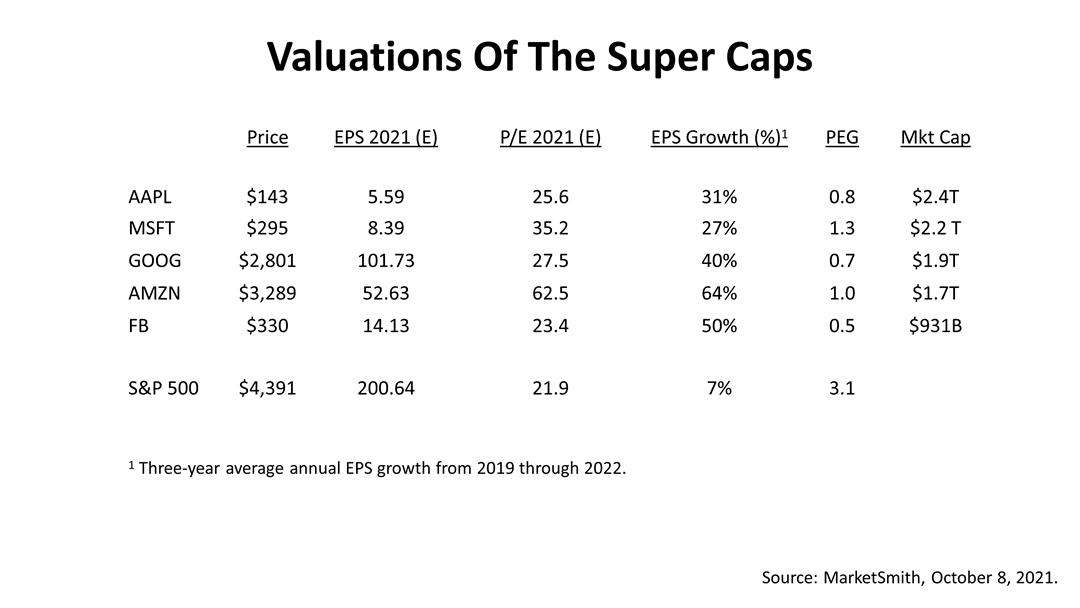
With a $2.4 trillion market–capitalization on Apple, and $2.2 trillion market-cap on Microsoft, these super-caps are expected to grow their profits at 31% and 27%, respectively. As a result, the Super Caps are trading at low PEG ratios relative to the other 495 stock stocks in the S&P 500 index.
A PEG ratio is a company’s price/earnings ratio divided by its earnings growth rate for the year ahead. A PEG ratio adjusts the traditional price/earnings metric for valuing a company’s stock by accounting for its expected earnings growth rate.
These five stocks may appear expensive relative to the S&P 500’s average P/E ratio of 21.9, but their earnings growth rate is reflected in the PEG ratios, and they are cheap by this important metric relative to the other 495 companies in the index. For example, the expected earnings growth rate for Amazon is 64%. Amazon's PEG ratio is 1.0% versus the S&P 500's PEG ratio of 3.1.
Stocks are risky investments and they are volatile. The S&P 500 suffered intraday declines of 2% this past summer and one-day losses of more than 1%, but it repeatedly bounced back and hit new highs. Uncertainty about the risk of the Covid-19 variant as well as inflation is likely to cause big drops in the S&P 500 in the days ahead.
Yet stocks are the growth engine of a retirement portfolio and a key in building a tax-smart investment plan with the objective of lasting the rest of your life.
This table entitled was derived from a class for financial professionals by Fritz Meyer, an independent financial economist, on Advisors4Advisors on October 13, 2021.
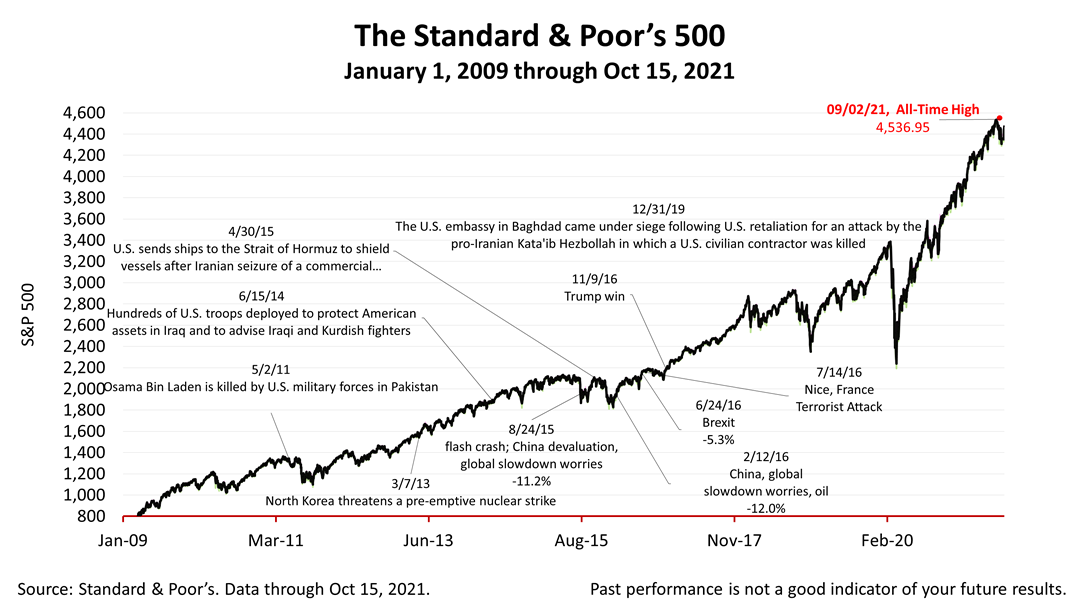
The Standard & Poor’s 500 stock index closed Friday at 4,471.37, gaining +0.75% from Thursday and +1.8% from last week. The index is up +66.59% from the March 23, 2020, bear market low.
Nothing contained herein is to be considered a solicitation, research material, an investment recommendation, or advice of any kind, and it is subject to change without notice. Any investments or strategies referenced herein do not take into account the investment objectives, financial situation or particular needs of any specific person. Product suitability must be independently determined for each individual investor. Tax advice always depends on your particular personal situation and preferences. You should consult the appropriate financial professional regarding your specific circumstances. The material represents an assessment of financial, economic and tax law at a specific point in time and is not intended to be a forecast of future events or a guarantee of future results. Forward-looking statements are subject to certain risks and uncertainties. Actual results, performance, or achievements may differ materially from those expressed or implied. Information is based on data gathered from what we believe are reliable sources. It is not guaranteed as to accuracy, does not purport to be complete, and is not intended to be used as a primary basis for investment decisions. This article was written by a professional financial journalist for Advisor Products and is not intended as legal or investment advice.
This article was written by a professional financial journalist for Advisor Products and is not intended as legal or investment advice.
2024
-
 Stocks Closed At A Record High
-
 Federal Reserve Projects Strong Growth
-
 The Best People Were Wrong
-
 This Week’s Investment News In Six Charts
-
 U.S. Investor Picture Of The Week
-
 The Conference Board Backs Off Its Recession Forecast
-
 Softening Economic Data, Inflation Fears Dampen Stock Rally
-
 S&P 500 Closes Above 5000 For The First Time Ever
-
 Why America Is The World’s Economic Leader
-
 Investment News For The Week Ended Friday, January 26
-
 Why Stocks Broke The All-Time Record High
-
 A Strategic Update, With Stocks Near All-Time High And Crises Unfolding


")


